
How we study this
Most studies of who works with whom ask about one relationship at a time. Does this school work with the police? Does that one work with a charity?
A two-mode network puts them back together. The easiest way to see what one is starts with something you already know.
Think of the clubs at a school. You could write down who is friends with whom: a line between Maya and Sam, another between Sam and Priya. That is an ordinary network. It has one kind of thing in it, students, and the lines run between students.
Now write down something different. List the students down the side of a page and the clubs across the top, and put a tick in a box whenever a student belongs to a club. That is a two-mode network. It has two kinds of thing in it, students and clubs, and a line only ever runs from a student to a club. A student is never in another student. A club is never in a club. The lines cross between the two kinds and never inside either one.
This study is that page, with schools instead of students and outside organizations instead of clubs. There are 12,691 rows, one for each school's answers in one survey, and seven columns, one for each of the outside organizations a school can work with: civic groups, local businesses, churches, social services, mental-health providers, juvenile justice agencies and the police. The survey also asks about parents' groups, and they get no column, because a parents' group is part of the school itself. A tick in a box means that school works with that organization. The whole study is that one page of ticks.
Why bother thinking of it as a network at all, rather than as a spreadsheet? Because writing it this way means you have to look at a school's whole row at once. Asking "does this school work with the police?" reads a single box. Asking "how many of the seven does it work with, and which ones?" reads the row. Those are different questions, and the second is the one this study asks.
Robert Breiger pointed out in 1974 that a table like this can be read in two directions at once. Read across the rows and it describes schools by the organizations they work with. Read down the columns and it describes organizations by the schools that work with them. He called that duality, and it is the reason a table of memberships is a network rather than a list.
What the study we build on did
The same way of looking has been used on something completely different.
In Switzerland people were arguing about chemicals in the rivers. Some of it runs off farms. Some of it comes from medicines and cleaning products that go down the drain. The government could do various things about it. Tax something. Ban something. Pay people to change how they work.
Three researchers, Florence Metz, Philip Leifeld and Karin Ingold, studied that argument in the Journal of Public Policy in 2019. They took 30 organizations with a stake in it, including government offices, industry bodies and environmental organizations, and 15 things the government could do. For each organization they recorded which of the fifteen it wanted.
The ordinary way to study that asks about one measure at a time. Does this body want the tax? Their point was that an organization deciding about a tax is also looking at the ban beside it. Wanting comes in sets, so they looked at each organization's whole set at once.
They found the choices clustered. An organization wanting one measure tended to want particular others as well, so the fifteen were not fifteen separate decisions. And the clustering followed the relations between the organizations: two that worked together tended to want the same things, and two on opposite sides of the argument tended not to.
Hans Bressers and Laurence O'Toole had argued much the same in the same journal in 1998, before anyone had a way of showing it.
What we do with it
We ask their question of schools. In their study the ones doing the choosing were organizations and the things chosen were government measures. In ours the ones doing the choosing are schools and the things chosen are seven kinds of organization.
Our case lacks the last part of their answer, and that makes our case the better one for the question we ask.
Their 30 organizations all knew each other. They worked together, they fell out, and those dealings explained the clustering they found. So when one of them ends up wanting a lot of measures, you cannot tell whether that came from pressure on the organization or from the company it keeps.
Our 12,691 school responses come from schools that do not know each other. A school in Ohio has no idea what a school in Oregon works with. Nobody is copying anybody. So when a school works with a lot of organizations, the company it keeps is not the explanation, and we can go looking for what is.
Two more differences. Theirs is one argument at one moment. Ours is the same eight questions asked six times over sixteen years, so we can watch the pattern change. And theirs is 30 groups against our 12,691 school responses, about four hundred times as many, so small patterns show up here that would be invisible there.
The one other study of these eight questions
Someone got to this battery before us, and her work is worth setting out properly.
Erica Bower used the same organization questions on the 2007-08 survey, first in her master's thesis at Old Dominion University in 2017 and then in The Social Science Journal in 2024. She asked a different question. She wanted to know whether involving parents and outside groups goes with less delinquency in schools.
In the 2024 article she measures parental involvement from how many parents turn up to school events, and she splits the seven organizations into two scores. A formal score counts social services, juvenile justice, law enforcement and mental-health providers. An informal score counts civic groups, businesses and religious organizations. More parental involvement goes with fewer recorded incidents, about 6% fewer for each point on her scale. A higher formal score goes with more, about 9% more for each point. The informal score makes no measurable difference. She notes that one survey cannot tell whether trouble brings the agencies in or whether the agencies being there puts more incidents on the record.
Two differences set her work apart from ours. Both follow from the question she was asking.
Her scores do not keep the organizations apart. The article's formal score puts the police and mental-health providers in the same count, so a school that swaps one for the other scores the same either way. The thesis goes further and adds all eight answers into one score from 0 to 8.
And she uses the principal's description of the neighborhood as a control, one of six measures she holds still in the article. There, schools whose principals call the area high-crime record about half again as many incidents as schools whose principals call it low-crime. In the thesis the same control predicted less delinquency than she expected.
So the same answer does opposite jobs in the two studies. For her it is something to hold still while she looks at crime. For us it does the explaining, and the school's ties are the outcome we try to account for. That is why we can see the swap. As the reported crime level rises, principals take on social services and mental-health providers in place of the police.
What the model does
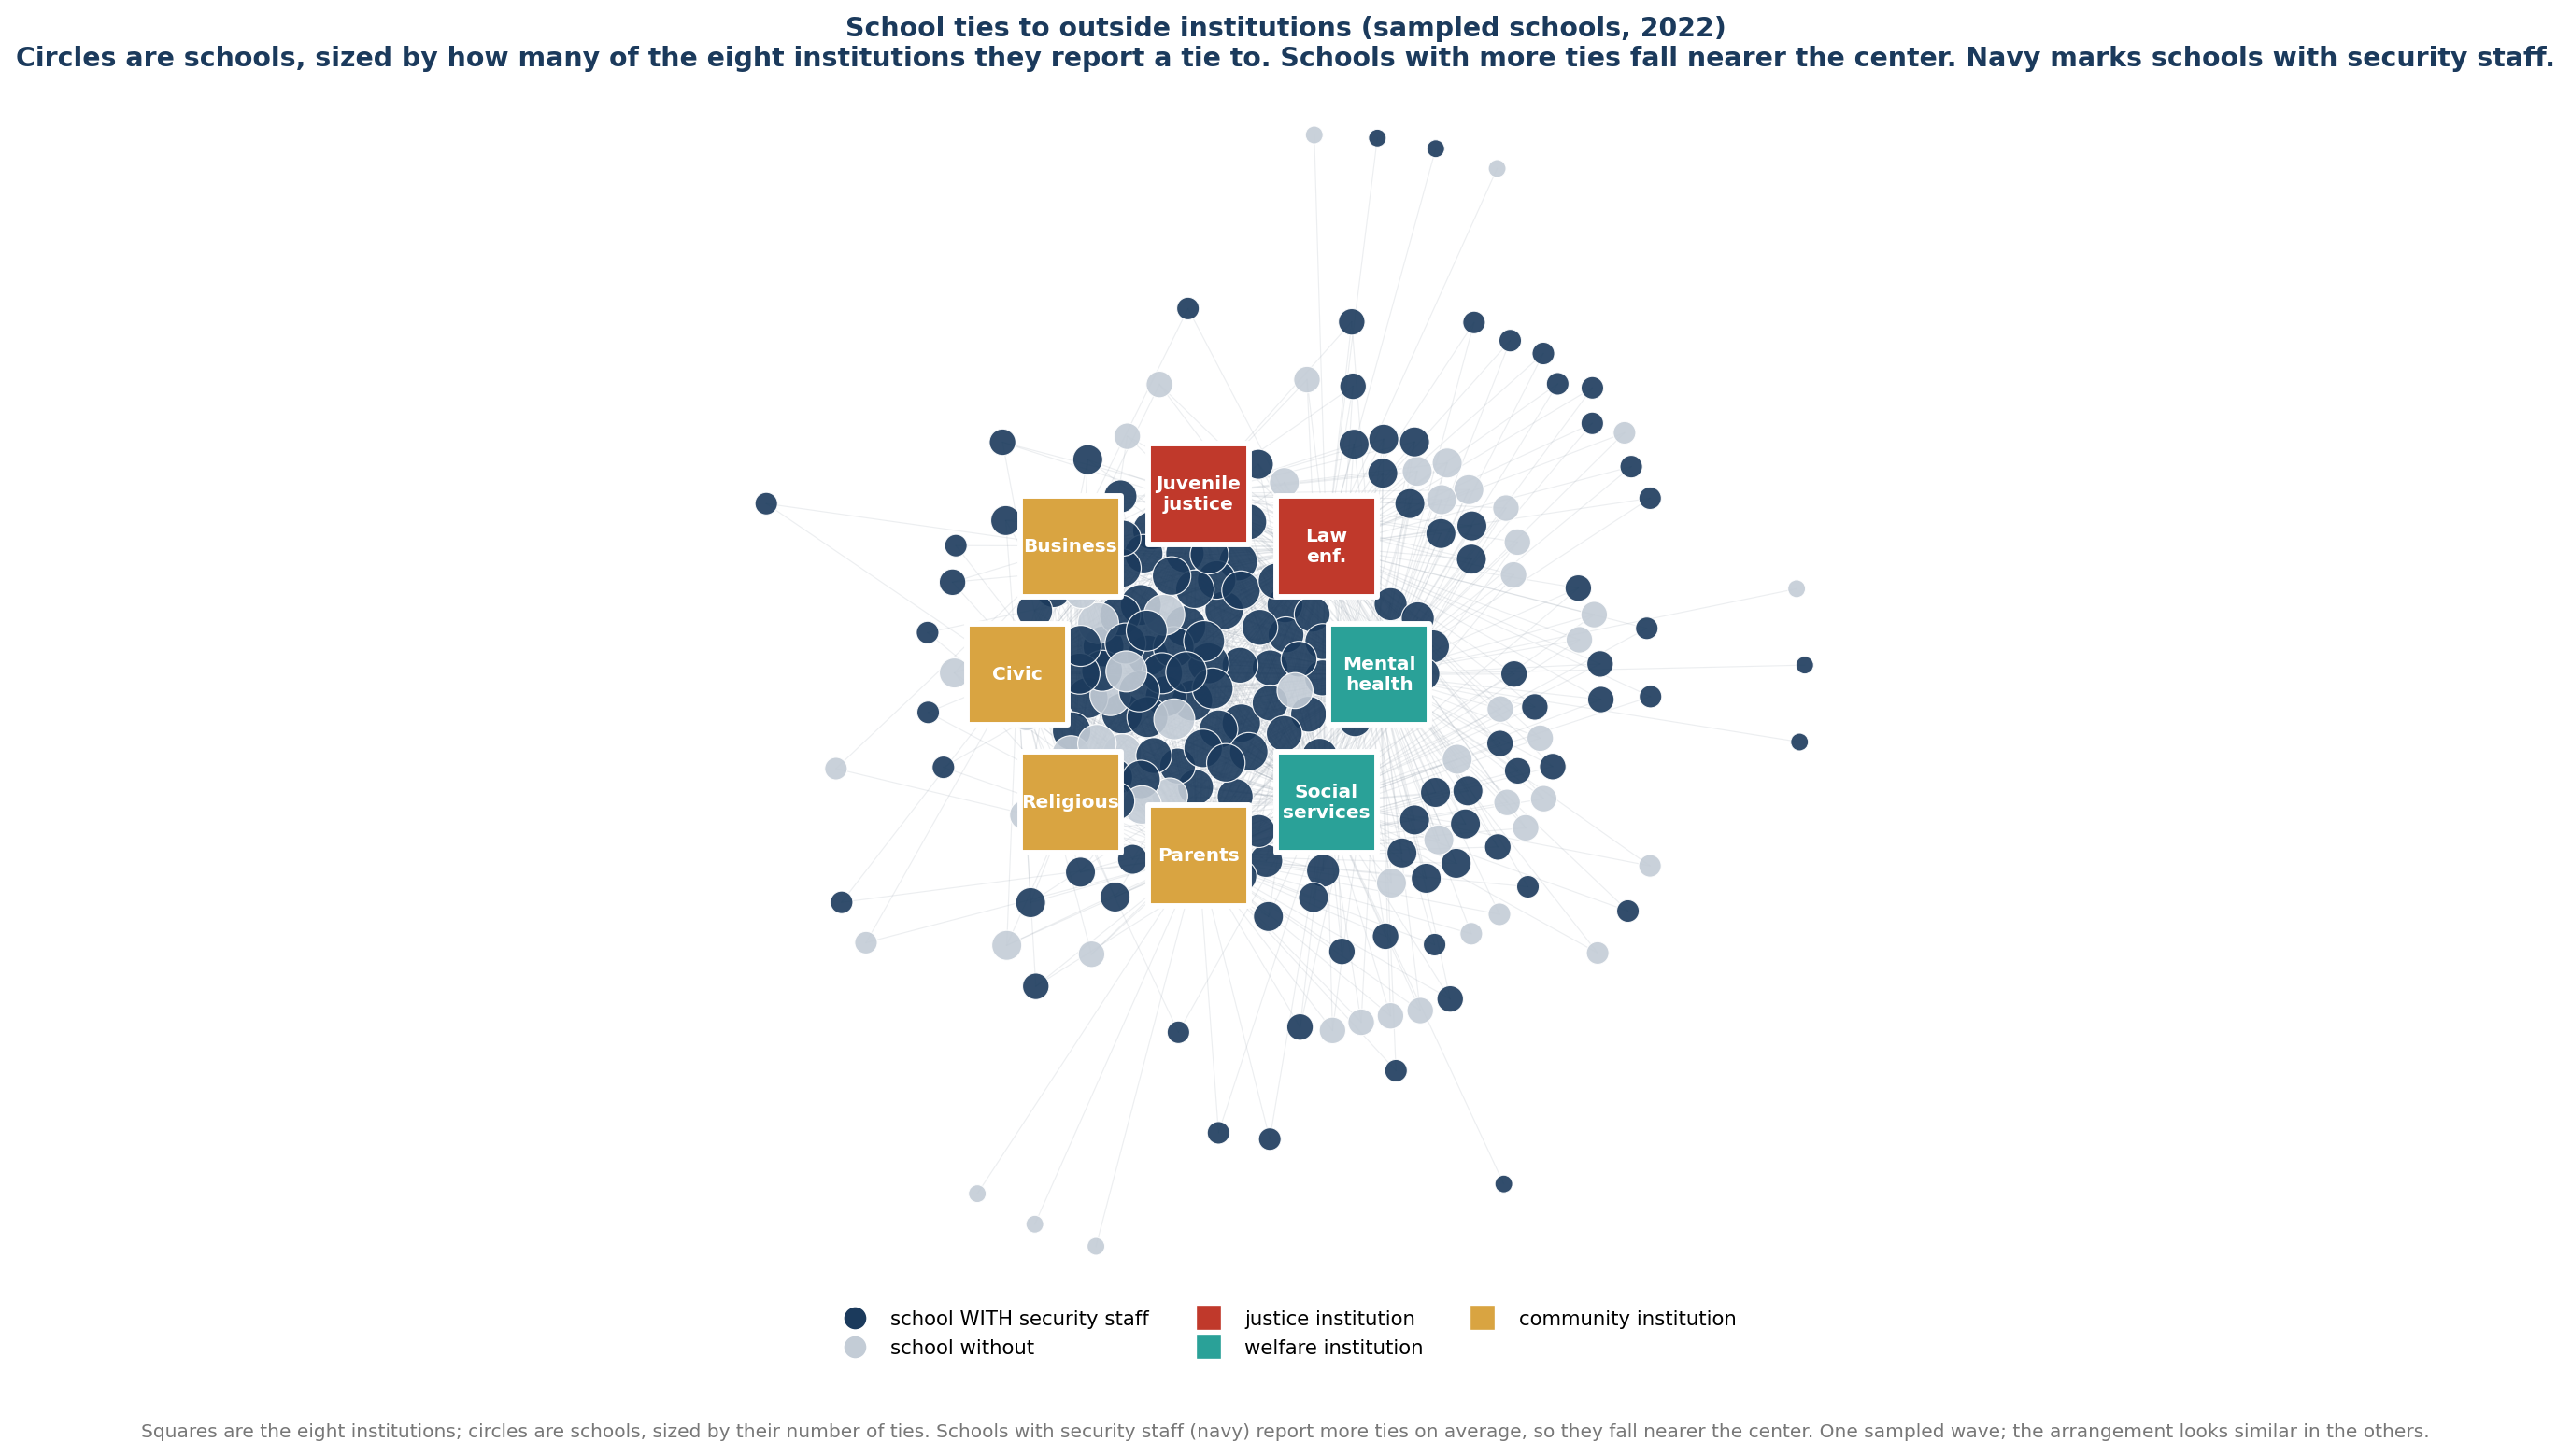
The picture below shows the table as a network for one survey year. Squares are the seven organizations, circles are schools, and a school is drawn nearer the middle the more organizations it works with.
We then fit a model of the whole network at once, called an exponential random graph model. It asks a simple question in a complicated way: given how many lines there are in total, are they spread across schools the way chance would spread them? They are not. Some schools hold far more than chance would give them, and that unevenness is the first result in this study.
What this method buys
Every school in the study works with some of the seven organizations. Say a school works with four of them.
That fact has two parts: the number, four, and which four they are.
Most studies keep only the number. The one other study of these survey items added the eight answers into a single score from 0 to 8. After that, a school with four partners looks the same whether or not the police are one of the four.
We keep both parts. The model can hold the number of partners still and ask which ones they are. A study working through one relationship at a time cannot do that, because it never has the whole set in front of it.
Do it, and one organization behaves differently from the other six. As the crime a principal reports goes up, a school works with more organizations, and the police get less likely to be among them. Comparing schools that work with the same number of organizations, across all six surveys, the police are about 3 in 100 less likely for every standard deviation of the crime rating, and about 10 in 100 less likely from a low-crime to a high-crime area.
Column 3 of Table 1 runs that same comparison inside the network model, on the 2015-16 survey on its own. A second check on that survey compares each school's police answer with its own answers about the other six organizations, and there the police come out about 5 in 100 less likely for every standard deviation of the crime rating. The finding is the same either way.
The articles this builds on
Bower, E. (2017). Working Together: Examining the Effects of Parental and
Community Involvement in Schools on School Delinquency. Master's thesis, Old Dominion
University.
Bower, E. (2024). It takes a village: examining social capital effects of parental and community
agency involvement on school delinquency. The Social Science Journal 61(3):
625–638. https://doi.org/10.1080/03623319.2020.1848292
Breiger, R. L. (1974). The duality of persons and groups.
Social Forces 53(2): 181–190.
Bressers, H. and O'Toole, L. J. (1998). The selection of policy instruments: a network-based
perspective. Journal of Public Policy 18(3): 213–239.
Metz, F., Leifeld, P. and Ingold, K. (2019). Interdependent policy instrument preferences: a
two-mode network approach. Journal of Public Policy 39(4): 609–636.