
We looked at 12,691 US public schools across six national surveys from 2005-06 to 2021-22, and at which outside organizations they work with on safety. Where principals say the neighborhood is high-crime, schools work with more outside organizations, but they are less likely to work with the police: about 7 percentage points less overall, and about 10 points less among schools with the same number of partners. Instead, these schools more often work with churches, mental-health providers and local businesses. The pattern shows up in every one of the six surveys, and it does not come from schools cutting contact, since they still report incidents to the police at about the same rate. Working with the police is still the most common tie overall, at 84% of schools, but in high-crime areas mental-health providers and social services are about as common as the police (75% and 73% against 72%). We argue that the pattern fits resource dependence theory: schools under pressure reach out for help, but avoid giving the police, who have the most power over their students, a role in running their safety work.
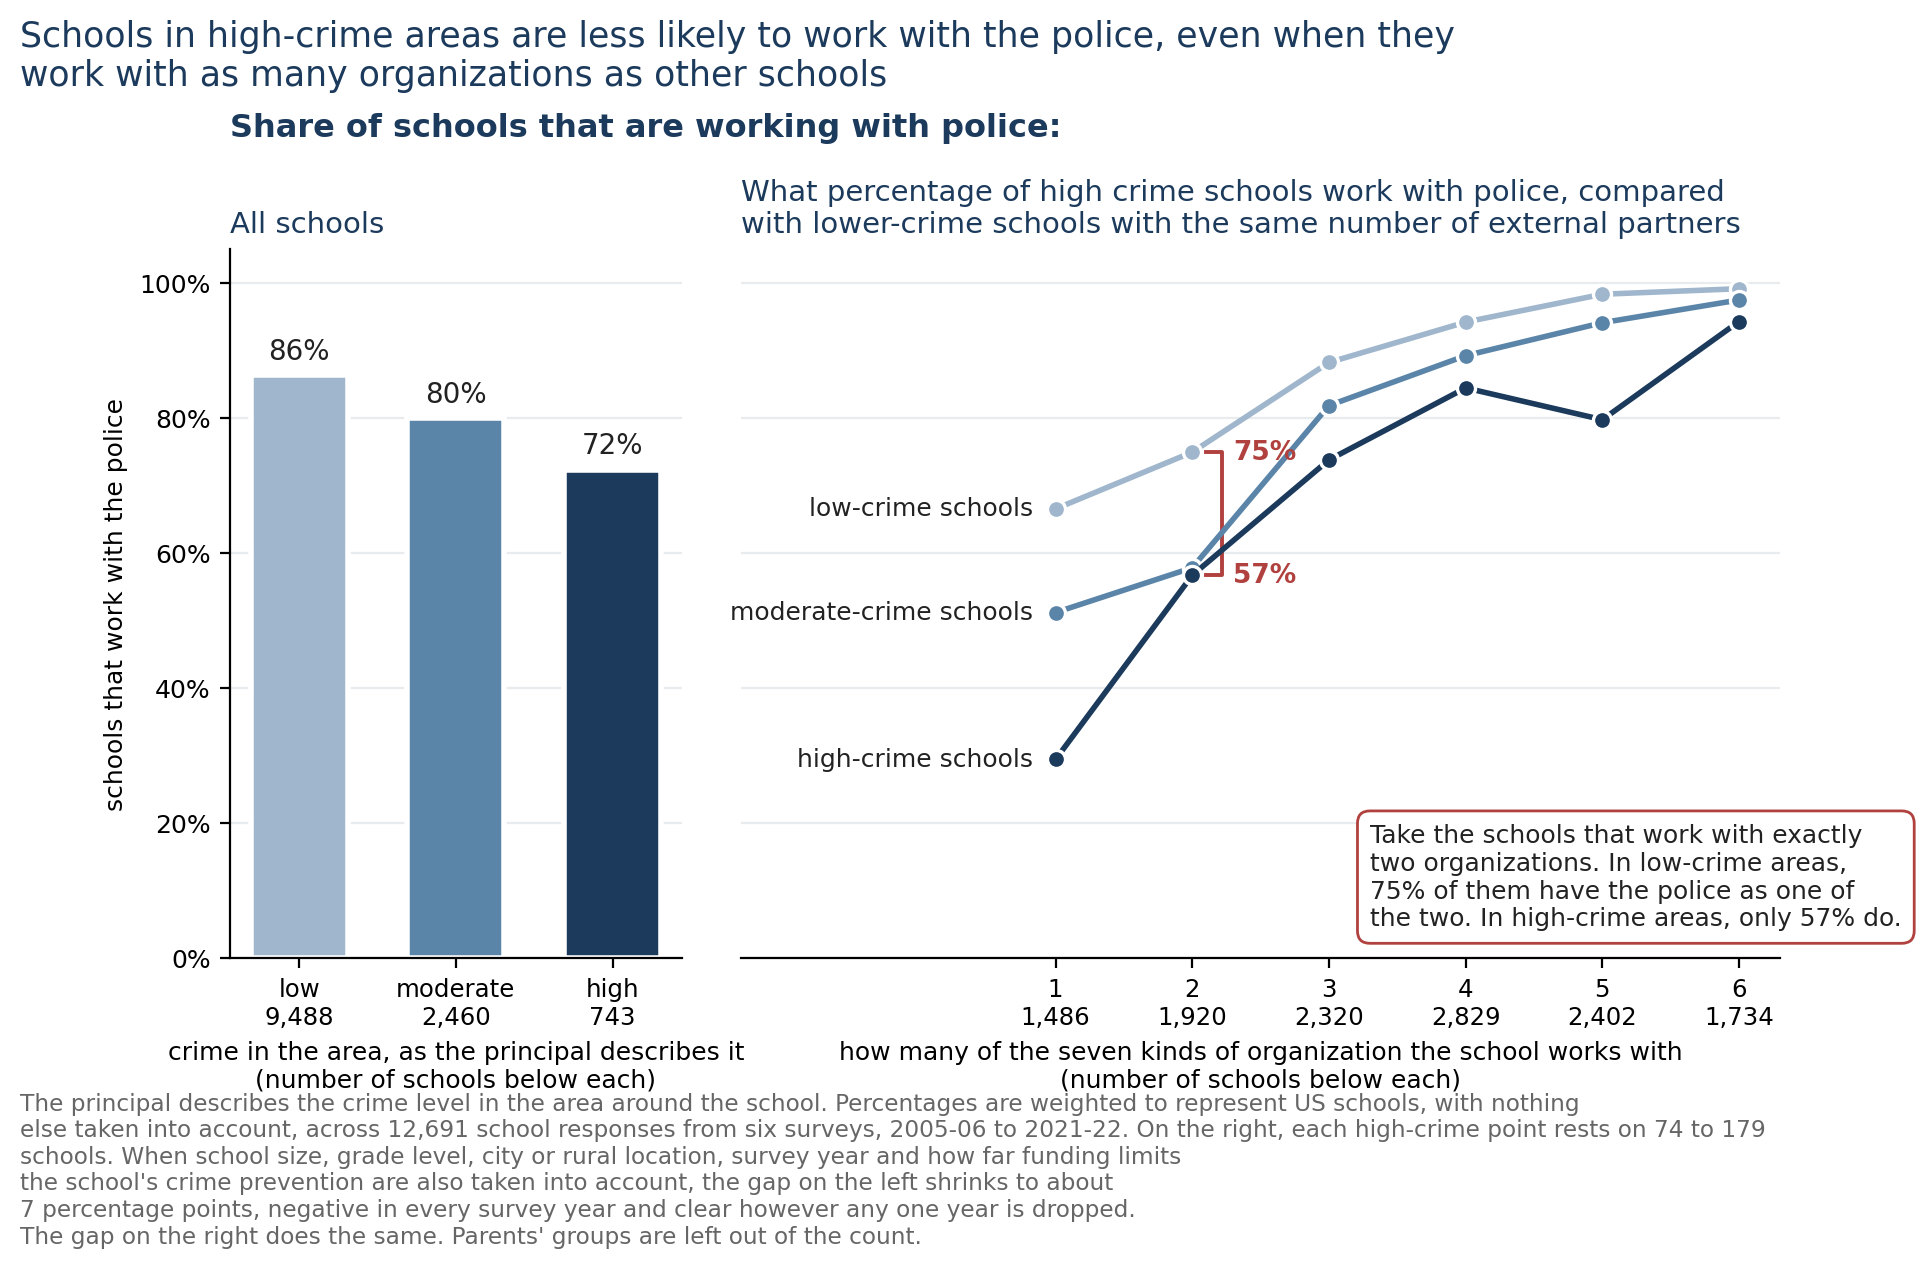
Three things happen together where principals call the area high-crime. First, schools there work with more outside organizations: 3.6 of the seven on average, against 3.3 where the principal calls crime low. Second, fewer of them work with the police at all: 72% against 86%, and about 7 percentage points fewer once school size, grade level, city or rural location, survey year and funding limits are taken into account. Third, among schools with the same number of partners, the high-crime ones are about 10 percentage points less likely to count the police as one of them, and hold other organizations in that place. Both police results show up in all six surveys, from 2005-06 to 2021-22. Leave out any one survey, including the pandemic year, and both are still clearly there.
Put the third as two schools working with the same number of organizations, four each. At one the principal calls the area low-crime. At the other the principal calls it high-crime. The high-crime one is about 10 percentage points less likely to have the police among its four. Neither has more room than the other, so the question is only which four.
12,691 schools · 7 organizations · 6 surveys · 2005-06 to 2021-22 · weighted to represent US schools
$ data & code run real R in this tab no install · R, Python, curl, JSON, citation
This is a real R session, running in your browser through
webR.
Nothing is sent anywhere. The survey is already loaded as
schools, a data frame of 13,167 rows, with
the survey weight in w. The first run downloads R itself, about
30 MB.
Press Run. The first run takes a moment while R downloads.Where principals report more crime, schools take care providers rather than the police
what they take instead of the police
Keep only the schools working with exactly one of the police and the organization named. Then ask which of the two it is. A positive number means that as the crime a principal reports rises, the school facing that either-or holds the other one rather than the police.
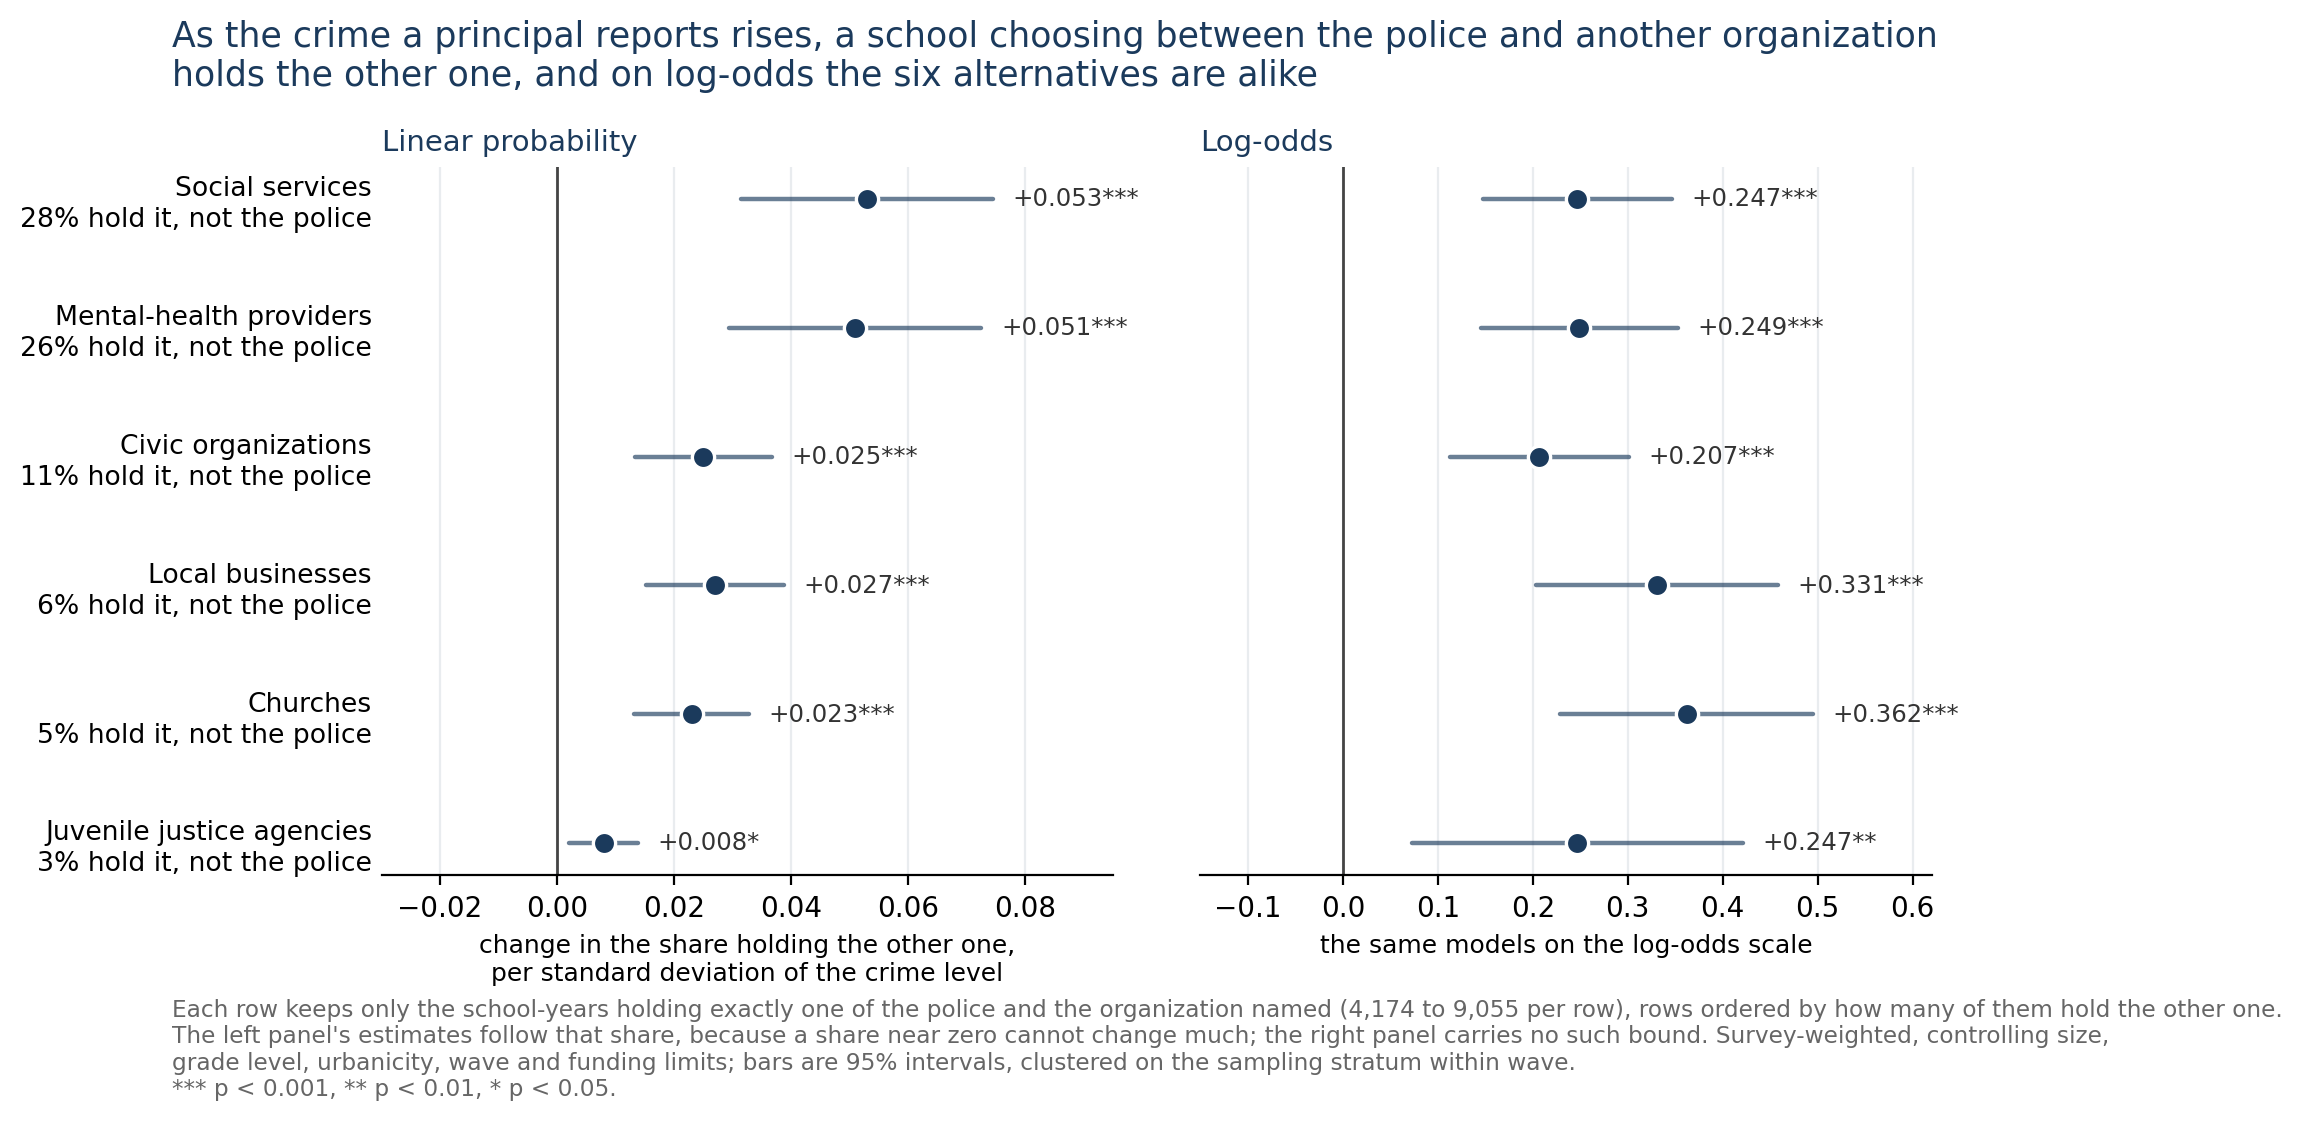
| Social services instead of the police | +0.053*** | (0.011) | 4,174 |
| Mental-health providers instead of the police | +0.051*** | (0.011) | 4,274 |
| Local businesses instead of the police | +0.027*** | (0.006) | 8,744 |
| Civic groups instead of the police | +0.025*** | (0.006) | 6,829 |
| Churches instead of the police | +0.023*** | (0.005) | 9,055 |
| Juvenile justice agencies instead of the police | +0.008* | (0.003) | 5,938 |
The police give way to every one of these organizations. The size of each number follows how many schools hold the other organization at all, because a share near zero cannot change much, so the column does not rank them. Measured in a way that does not depend on how common each organization is, the six come out alike, and juvenile justice sits among the rest rather than below them. This is not the police simply being the commonest of the seven. The effect is strongest among schools working with only one to three organizations, where the police are least common: 74% of those schools work with the police, against 84% of all schools. Table 19.
and the police are not among what they add
Where the principal reports more crime, a school works with more organizations, and among schools with the same number of partners it is less likely that one of them is the police. That is true in every one of the six surveys, and it does not depend on any one of them: leave out any single survey, the pandemic year included, and the gap stays between -10.3 and -8.7 percentage points.
| How many organizations a school works withall seven, comparing schools a step apart on the principal's description of the area (one standard deviation) | +0.104*** | (0.024) |
| Whether one of them is the policeamong schools with the same number of organizations, so this is which ones rather than how many | -0.028*** | (0.005) |
Which organizations take up the difference? Compare schools working with the same number of organizations, taking into account school size, grade level, city or rural location, survey year and how far funding limits the school's crime prevention. A school whose principal calls the area high-crime is about 10 percentage points less likely than one whose principal calls it low-crime to work with the police. It is more likely to work with churches (about 4 points), mental-health providers (about 4 points) and local businesses (about 4 points). Social services, juvenile justice agencies and civic groups do not change by an amount that can be told apart from zero.
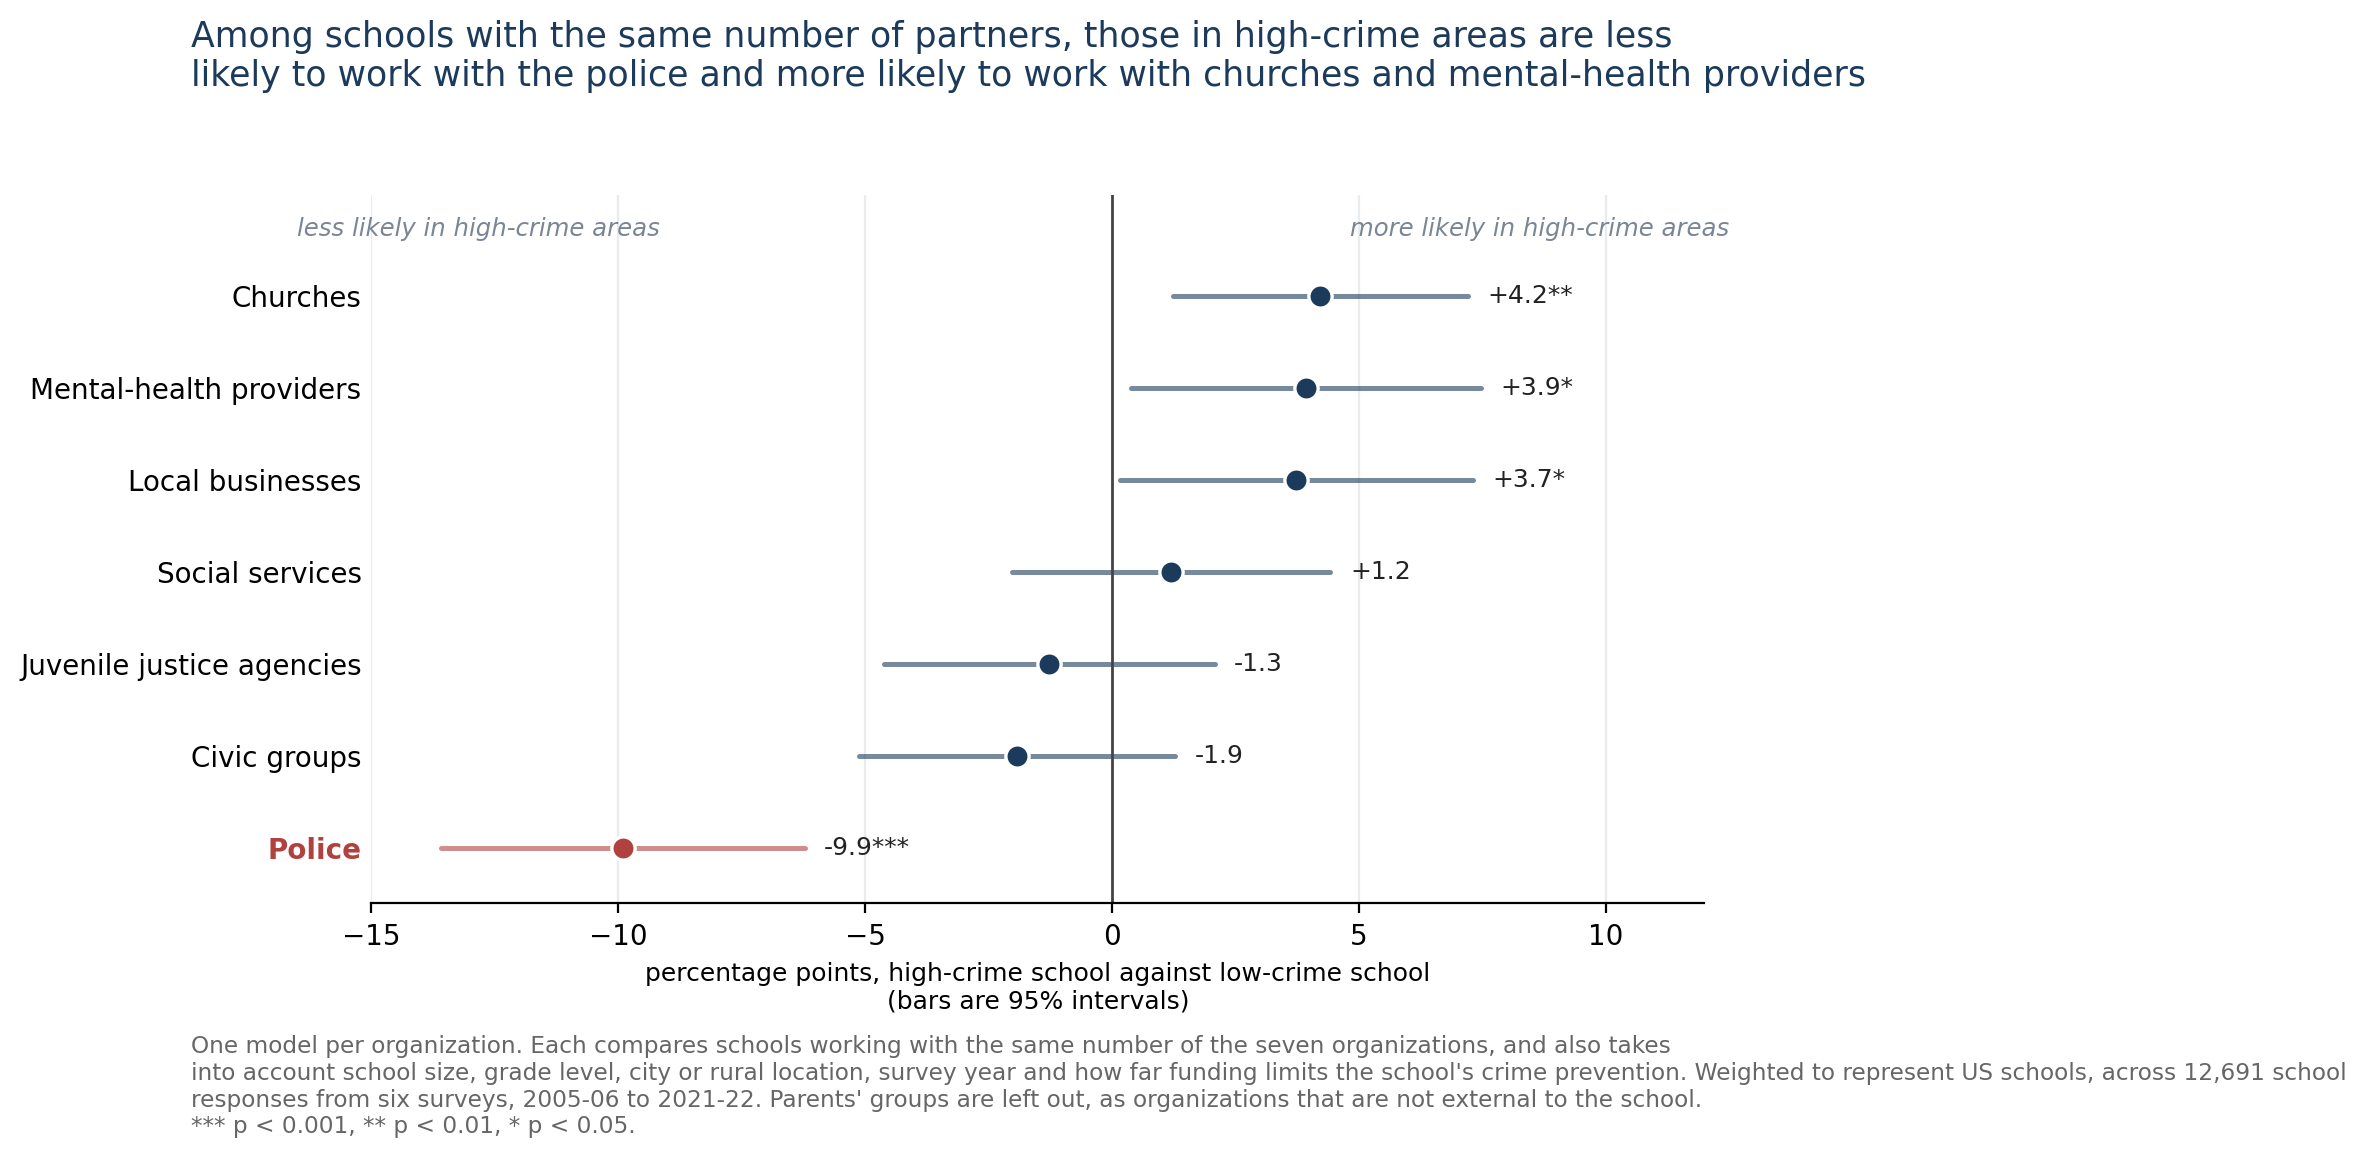
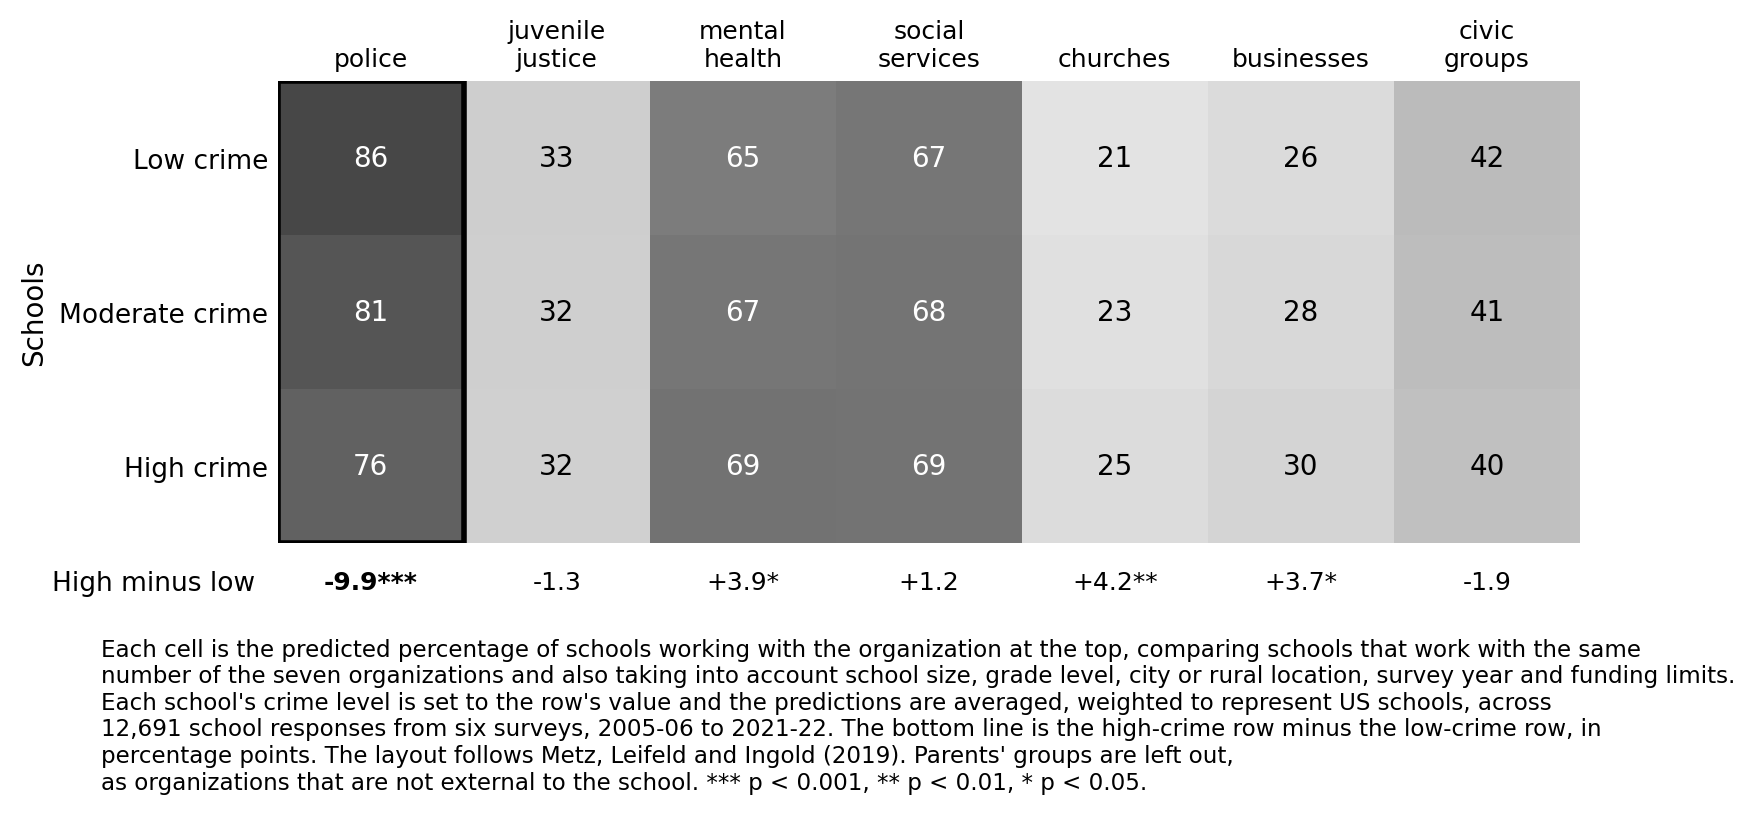
Someone could object that this is just more police in schools under a different name. If that were right, then counting only the other six organizations and leaving the police out should make the pattern weaker. It makes it stronger.
| The count of all seven | +0.104*** | (0.024) |
| The same count with the police taken out | +0.124*** | (0.022) |
84% of schools work with the police already, the highest share of the seven. Counting all schools, whatever their number of partners, a school in a high-crime area is about 7 percentage points less likely than one in a low-crime area to work with the police at all. The three tests in full →
The seven organizations, and how many of them a school works with
which organizations, and how often
The share of US schools working with each of these seven organizations, across all six surveys and weighted to represent all US schools. A school works with 3.4 of the seven on average. Parents' groups are not counted, because they are part of the school rather than outside it.
The police, at 84%, are already close to universal. As the crime level a principal reports rises, five of these seven organizations become more common and the police become less common. Table 13 gives the same shares beside each organization's coefficient. Filter these by survey, grade level and area → Link to this panel
and what changed over sixteen years
Which organizations schools worked with changed between 2005-06 and 2021-22. How many they worked with changed little. Work with juvenile justice agencies fell from 42% of schools to 26% and work with mental-health providers rose from 55% to 78%, while the other five barely changed, and a school worked with about 3.2 of the seven at the end.
What predicts how many a school works with
what predicts it
How many more of the seven organizations a school works with, comparing a school with a typical one that sits a step higher on the measure named in each row (one standard deviation). Weighted to represent all US schools; the numbers in brackets are the margin of error; 12,691 school responses.
| What the school already runssecurity staff, a formal process for consulting parents, and security equipment, combined into one measure | +0.38*** | (0.020) |
| How the principal describes crime in the areawith what the school already runs also in the model | +0.07** | (0.023) |
Read the first row like this. Take two schools and give one of them more of all three: more security staff, a proper process for talking to parents, and more security equipment. That better-equipped school works with about 0.4 of an organization more out of the seven. It is true in all six surveys and in primary, middle and high schools alike. Leave any one survey out and the answer stays between +0.362 and +0.392. The second row depends on the first. The principal's description predicts more in schools that run less themselves: it is clear in schools at or below average on what they run, and cannot be measured in schools well above average. The two pull against each other slightly, by -0.028, an amount too small to tell apart from zero on its own. Table 6.
and the crime rating is not just an impression
The crime level here is not a police statistic. It is what the principal said when asked. So we checked that answer against three things the study never uses it to predict.
Crimes actually recorded at the school that year
| +0.103*** | (0.011) |
How often staff report bullying and harassmentTo the best of your knowledge, how often do the following types of problems occur at your school?
| +0.154*** | (0.011) |
How many parents turn up to school eventsWhat is your best estimate of the percentage of students who had at least one parent or guardian participating in the following events during the school year?
| -0.185*** | (0.016) |
Three things the study never uses the crime reading to predict. Where a principal reports more crime, the school has more crimes actually recorded against it, staff report more bullying and harassment, and fewer parents turn up to school events. The turnout rows use the 8,774 school-years in the four surveys carrying those items. Table 21, top panel. Why this matters → Link to this panel
In counts: where the principal calls the area low-crime, the school records about 16 incidents of crime and violence a year on average; where the principal calls it high-crime, about 34. That holds among schools of the same size.
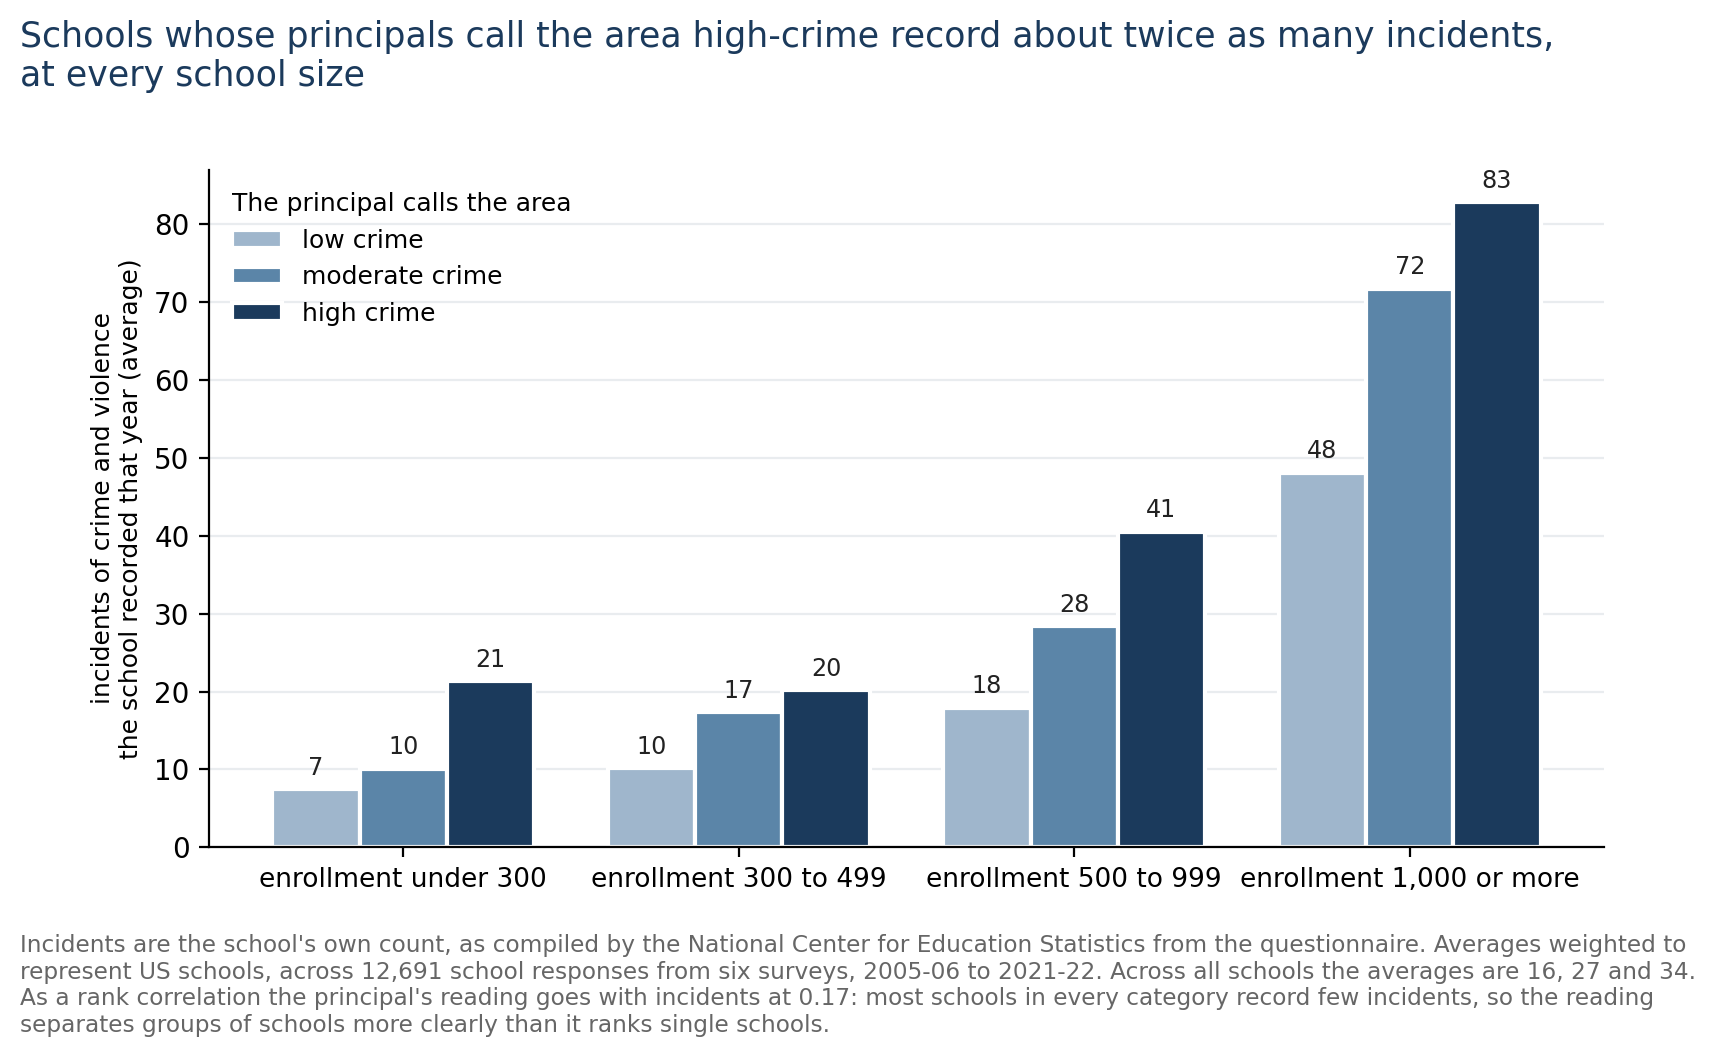
As a rank correlation the reading goes with recorded incidents at 0.17. Most schools in every category record few incidents, so the reading separates groups of schools more clearly than it ranks single schools. Table 22.
what does not predict it
Do better-off schools work with more organizations? Three measures of the student body, in the same model as what the school already runs and how its principal describes the area.
| Share expected to go to college | -0.057 | (0.022) |
| Share testing in the bottom fifteen per cent | +0.039 | (0.020) |
| Average daily attendance, per cent of students | +0.027 | (0.015) |
Entered together, two of the three measures of the student body can be told apart from zero, and both run the opposite way from what the social capital explanation predicts: schools with more students expected to go to college work with fewer organizations, and schools with more students testing in the bottom fifteen per cent work with more. Nothing here suggests that better-off schools work with more organizations.
Introduction
Schools do not work alone. They deal with local businesses, churches and civic groups. They also deal with social services, mental-health providers, juvenile justice agencies and the police. This study asks what decides how many of those seven kinds of organization a school works with. The survey asks about parents' groups too, and we do not count them, because a parents' group is part of the school itself.
The answers come from the School Survey on Crime and Safety, which the US government sends to school principals. It ran six times between 2005-06 and 2021-22. We use 12,691 of the answers.
Most research on this asks about one relationship at a time. Does this school work with the police? Does that one work with a charity? Asking one at a time misses something, because a school does not decide each relationship on its own. You have to look at the whole set together.
The first thing we found is that schools differ a lot in how many of those seven they work with, far more than they would if each relationship were settled separately. But knowing that a school works with four of them tells you very little about which four. Any usual order for taking them on is faint: it shows up in three of the six surveys, and only just. There are no pairs that schools treat as alternatives. No group of schools favors the police and the courts while another group favors businesses and churches. Schools, in other words, do not come in types here.
So a school mostly varies in one way: how many outside organizations it works with. The sociologist Nan Lin calls that reach extensity, and he counts it as a form of social capital, meaning the resources a person or an organization can get at through the people and organizations it knows.
Two sets of measures predict that number.
The first set describes the school's own arrangements: security staff, a formal process for consulting parents, and security equipment such as cameras, metal detectors and locked doors. Schools with more of these work with more outside organizations. The size of the difference is about +0.377 of an organization for every standard deviation, which is a measure of how spread out a set of numbers is. Two schools one standard deviation apart are clearly different from each other without being extreme. This holds in all six surveys and at every grade level.
The second is the area around the school, as the principal describes it. Principals are asked to describe the crime level in the area around the school as low, moderate or high. Schools whose principals say high work with more outside organizations, by about +0.067 of an organization per standard deviation of that rating, even after the school's own staff and equipment are accounted for.
A school in a high-crime area works with more organizations. It works with more community groups and more government agencies, by about the same amount.
The police are the one organization those schools do not add. Take the police out of the count and the link between the principal's crime rating and the number of organizations gets stronger rather than weaker, +0.124 against +0.104. Compare schools that work with the same number of organizations and ask which ones they are, and the police become less likely as the crime rating rises, at -0.028 per standard deviation. From a low-crime to a high-crime area that comes to about 10 percentage points. The gap is negative in every one of the six surveys, and it holds whichever survey is left out, so the pandemic year of 2021-22 does not carry it. So this is not more policing under another name. Schools in the areas principals call high-crime work with more organizations, and the police are the one part of that which does not grow.
Which organizations schools worked with changed over the sixteen years while the number of organizations per school held steady. The front page charts it, and Full results sets it out.